
Build a Meeting Analytics Dashboard from Transcript Data

To build a meeting analytics dashboard, you process structured transcript data to extract metrics like speaker talk time and participation. This data is then stored in a queryable format, often a time-series or SQL database, and visualized using a tool like Grafana to display communication patterns and meeting effectiveness.
This process starts with getting clean, structured data out of meetings. Raw audio or a simple text file is not enough. You need precise timestamps and speaker labels. An AI voice agent that joins your calls is the most direct way to capture this information. As an active participant, the agent can record who said what and when, then deliver that structured data to your backend for analysis.
At MeetStream, we run the infrastructure for these agents across Zoom, Google Meet, and Microsoft Teams. We have processed over 1,000,000 meeting minutes and see a common pattern: developers need more than just a transcript. They need queryable data to build products on. This guide shows how to create that data pipeline, from capturing the data with a bot to visualizing it on a dashboard. Let's get into it.
Why Raw Transcripts Are Not Enough
A raw transcript is a wall of text. While useful for human readers, it is a difficult starting point for automated analytics. To calculate who spoke the most, you first need to solve speaker diarization, which is the process of attributing text to different speakers. Without this, you cannot measure individual talk time or analyze contribution balance.
Timestamps are also critical. A simple transcript does not tell you if a topic was discussed at the beginning or end of a call, or if there were long periods of silence. To build a timeline of the conversation, you need word-level timestamps. This allows you to analyze meeting flow, identify monologues, and measure participant engagement over time.
Finally, you need metadata about the meeting itself. Who was invited versus who attended? When did each person join and leave? This context is essential for building accurate meeting analytics. A participant who joins 30 minutes late has a different impact than one who is present for the entire call. A reliable data source must provide this participant lifecycle information alongside the transcript.
The Data Pipeline for Meeting Analytics
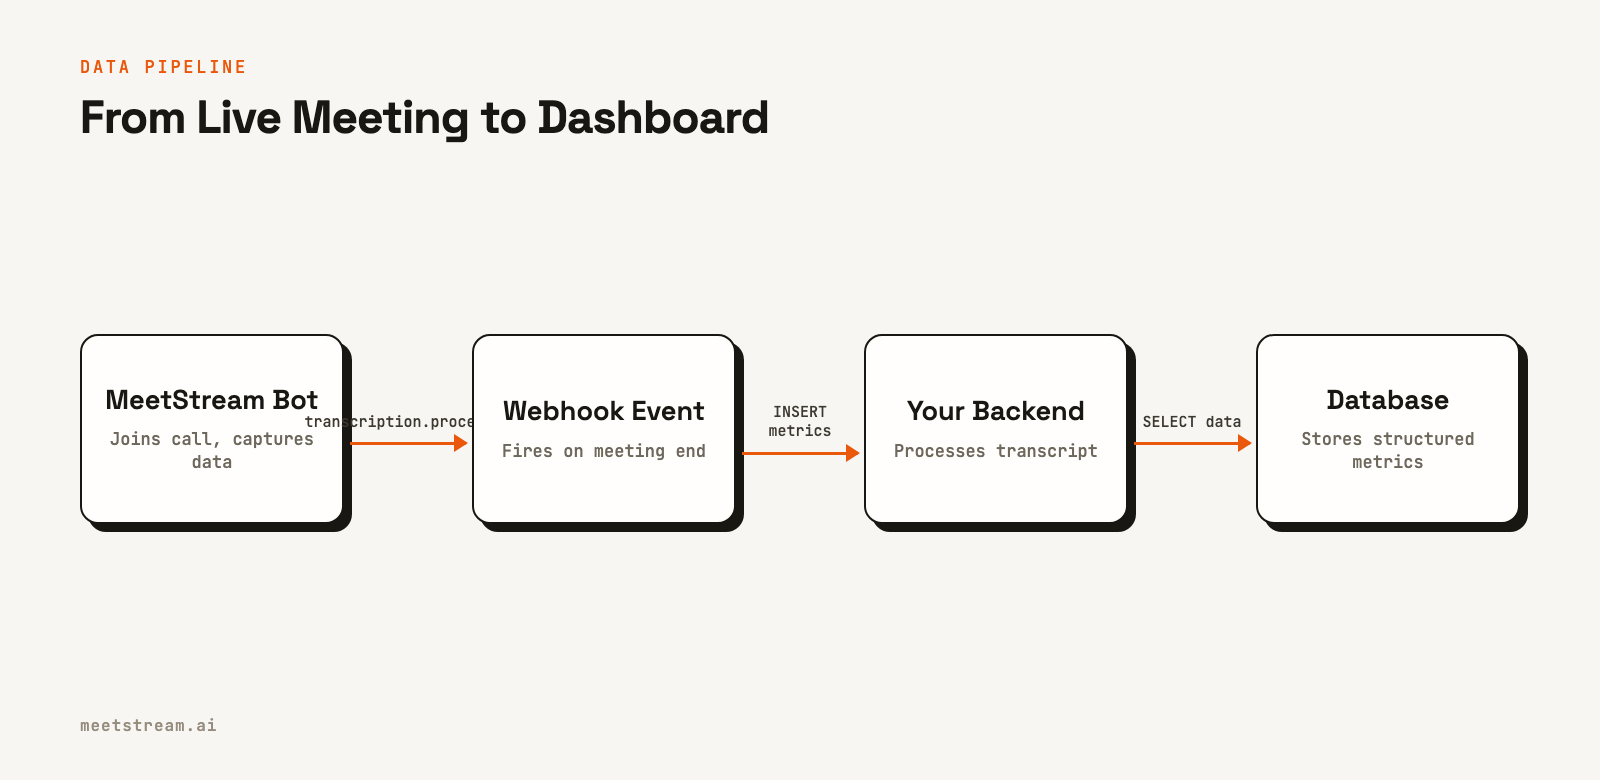
A reliable analytics dashboard is built on a simple, reliable data pipeline. The goal is to move data from a live meeting into a structured database with as little friction as possible. The architecture typically involves four stages.
First, a meeting bot joins the call on Zoom, Google Meet, or Teams. It captures the audio and metadata in real time. Second, once the meeting is over and the transcript is ready, the bot platform sends a webhook to your backend service. This event-driven approach is more efficient than constantly polling an API for status updates.
Third, your backend service receives the webhook, fetches the full, speaker-labeled transcript, and processes it. This is where you calculate your desired metrics: total talk time per speaker, word count, and any other custom analytics. Fourth, your service writes these calculated metrics into a database. A time-series database like InfluxDB or a standard SQL database like PostgreSQL are common choices. Grafana or another business intelligence tool then queries this database to populate the dashboard.
Step 1: Capturing Structured Data with a Bot
The pipeline starts with programmatic data capture. You can deploy a MeetStream bot into any meeting with a single API call. What matters is to configure it to send you the data you need for your dashboard.
In the `create_bot` request, you specify the `meeting_link`, a `bot_name`, and most importantly, a `callback_url`. This URL is the endpoint on your server that will receive webhook events. You also specify a transcription provider in the `recording_config` to ensure a transcript is generated.
curl -X POST "https://api.meetstream.ai/api/v1/bots/create_bot" \
  -H "Authorization: Token <YOUR_API_KEY>" \
  -H "Content-Type: application/json" \
  -d '{
    "meeting_link": "<YOUR_MEETING_LINK>",
    "bot_name": "Analytics Bot",
    "callback_url": "https://your-app.com/webhooks/meetstream",
    "recording_config": {
      "transcript": {
        "provider": {
          "meetstream": {}
        }
      }
    }
  }'
When the bot joins, it sends a `bot.inmeeting` event. After the meeting ends, the `transcription.processed` event fires. This is the signal to fetch the data. The webhook payload for this event contains the `bot_id` and other details. You will have received a `transcript_id` in the initial response to your `create_bot` call; you should store this ID alongside the `bot_id`.
With the `transcript_id`, you can retrieve the full, speaker-diarized transcript from the API. The data is a JSON list of segments, each with a speaker, the transcript, a start time, and an end time.
Step 2: Processing and Storing Meeting Data
Once you have the transcript data, your backend service needs to parse it and store it in a structured format. A simple relational database schema might include tables for meetings, participants, and utterances.
A `meetings` table could store the meeting ID, start time, and end time. A `participants` table could store each participant's name and their total talk time. An `utterances` table could store each spoken segment with a foreign key linking back to the participant and meeting.
Here is a simplified Python example using the `requests` and `psycopg2` libraries to process a transcript and insert talk time data into a PostgreSQL database.
import requests
import psycopg2

def process_transcript(transcript_id, db_conn):
    headers = {"Authorization": "Token <YOUR_API_KEY>"}
    url = f"https://api.meetstream.ai/api/v1/transcript/{transcript_id}/get_transcript"
    response = requests.get(url, headers=headers)
    transcript_data = response.json()

    # Calculate talk time per speaker
    talk_times = {}
    for segment in transcript_data:
        speaker = segment["speaker"]
        duration = segment["end_time"] - segment["start_time"]
        talk_times[speaker] = talk_times.get(speaker, 0) + duration

    # Insert data into the database
    with db_conn.cursor() as cur:
        for speaker, total_duration in talk_times.items():
            cur.execute(
                "INSERT INTO participants (speaker_name, talk_time_seconds) VALUES (%s, %s)",
                (speaker, total_duration)
            )
    db_conn.commit()
This script calculates the total talk time for each speaker and inserts it into a `participants` table. You can expand this logic to calculate more complex metrics for your meeting engagement dashboard.
Step 3: Visualizing Metrics in Grafana
With your data stored in a SQL database, you can connect Grafana to it and start building visualizations. Grafana has a built-in PostgreSQL data source that makes this straightforward.
A common first visualization is a pie chart showing the talk-time distribution. This gives an at-a-glance view of participation balance. The SQL query for this panel would be a simple aggregation.
SELECT
  speaker_name,
  SUM(talk_time_seconds) AS total_talk_time
FROM
  participants
WHERE
  meeting_id = $__url_variables_meeting_id
GROUP BY
  speaker_name
ORDER BY
  total_talk_time DESC;
This query groups the data by speaker and sums their talk time for a specific meeting, which can be selected dynamically in the Grafana dashboard. You can create other panels for different metrics: a time-series graph of speaker changes, a bar chart of meeting durations over a week, or a simple stat panel showing the total number of participants.
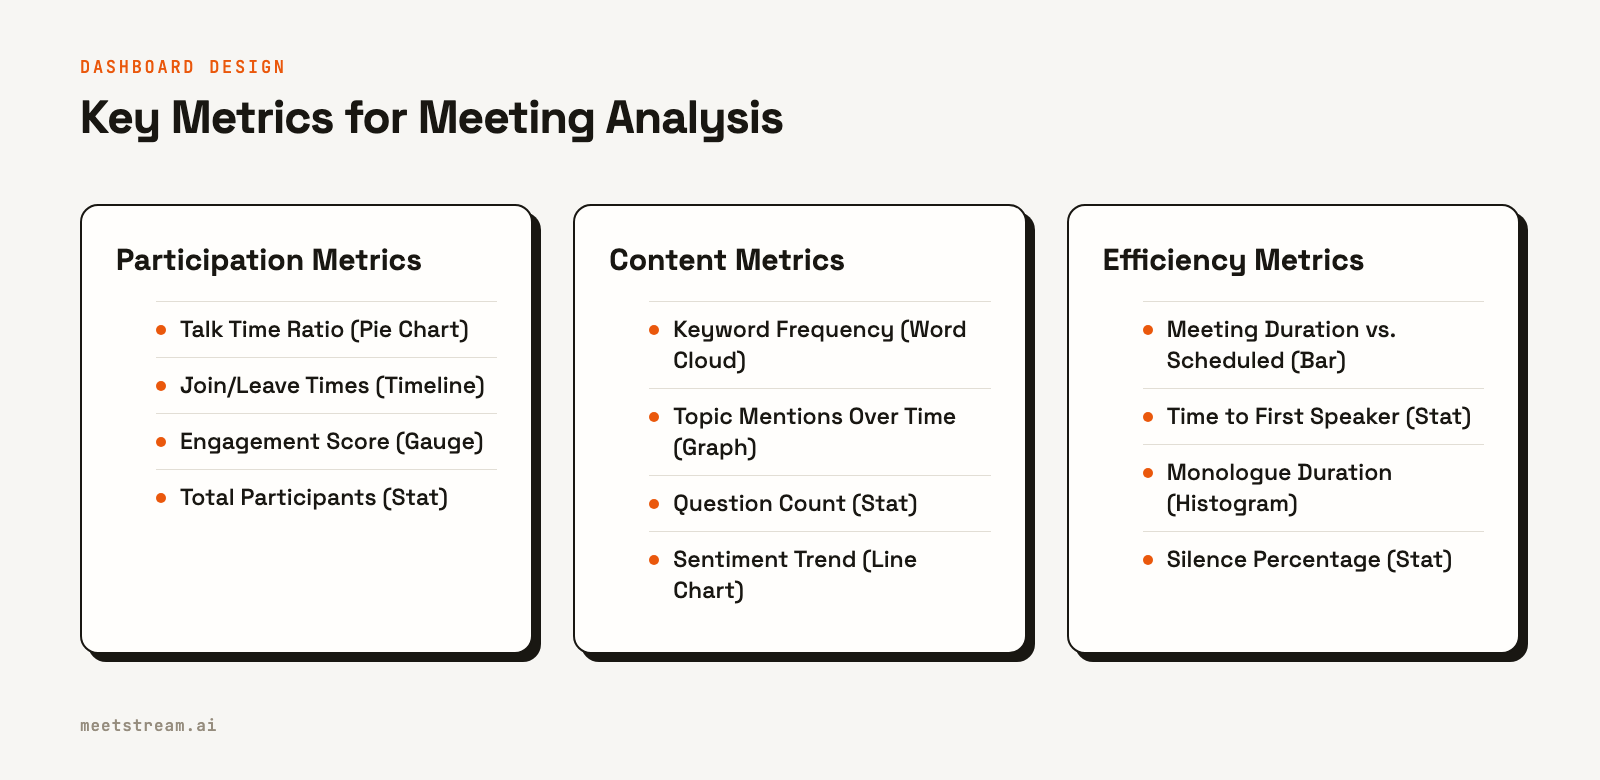
By combining different visualizations, you can build a complete dashboard that provides deep insights into your team's communication habits. This helps identify patterns like one person dominating conversations or meetings consistently running over time.
How MeetStream Provides the Foundation
Building a custom meeting bot analytics dashboard requires a solid data foundation. The hardest part is often getting reliable, structured data from live meetings across different platforms like Zoom, Google Meet, and Microsoft Teams. Each has its own complexities for authentication, media capture, and participant management.
MeetStream handles this infrastructure layer. Our unified API lets you deploy bots with one consistent interface, regardless of the meeting platform. We manage the scaling, reliability, and real-time media processing required to capture clean data. Your team can focus on building the analytics and user-facing features, not on maintaining a fleet of bots.
Our system is designed for developers building data-driven applications. With features like event-driven webhooks, detailed transcript speaker labels, and participant lifecycle events, you get the raw materials you need to build powerful dashboards and other meeting intelligence tools.
Conclusion
Building a meeting analytics dashboard from transcript data is no longer a large data engineering project. With the right API platform, you can establish a pipeline that feeds structured, speaker-labeled data directly from live meetings into your analytics backend. This allows you to focus on what matters: deriving insights and visualizing the communication patterns that define how your team works.
By using a bot to capture data and a tool like Grafana to visualize it, you can turn meeting conversations into a valuable dataset for improving collaboration and productivity. See the full API reference at docs.meetstream.ai.
Frequently Asked Questions
What data sources should feed a meeting analytics dashboard?
The core data sources are bot session logs for join times and duration, and transcript data containing speaker-labeled utterances with word-level timestamps. These should be stored in a data warehouse or database for efficient querying by your dashboard.
What visualization is best for showing speaker talk time distribution?
A pie or donut chart is effective for showing talk time percentages in a single meeting. For comparing talk time across multiple meetings, a stacked bar chart where each bar is a meeting and segments are speakers works well to show trends.
How do I build a real-time dashboard that updates during a live meeting?
A real-time dashboard requires a streaming data source. You can use MeetStream's real-time transcription feature, which sends transcript data over a webhook as it is generated, allowing you to push updates to your dashboard frontend via WebSockets.
What SQL query pattern is best for meeting analytics aggregations?
Use `GROUP BY` clauses to aggregate metrics per speaker, per meeting, or over a time period. For more complex analysis like measuring gaps between speakers, window functions like `LAG()` or `LEAD()` are very effective for comparing consecutive utterances.


