Meeting Bot Analytics: Usage and Performance Monitoring

Effective meeting bot analytics starts with tracking the right lifecycle events. To monitor performance, you need a way to capture when a bot attempts to join, when it successfully enters a meeting, and when it fails. This data, typically sent via webhooks, can be fed into a time-series database and visualized in a dashboard to track key health metrics like join success rate and processing latency.
This is especially important for the new generation of meeting bots. At MeetStream, we provide agent-first voice infrastructure for meetings, allowing developers to build AI agents that can join calls, listen, speak, and act. When your agent is an active participant, not just a passive recorder, silent failures are no longer an option. Observability becomes a core product requirement.
Without a solid analytics pipeline, you are flying blind. You cannot distinguish between a platform outage, a bug in your code, or a user providing a bad meeting link. A simple dashboard tracking a few key metrics can be the difference between finding out about a problem from an angry customer and catching it before it affects anyone.
Let's walk through the key metrics to track and how to build a simple, effective system for meeting bot analytics and performance monitoring.
Why Monitoring Meeting Bots Is Difficult
Monitoring services that interact with real-time communication platforms presents unique challenges compared to typical web services. Bots are transient, stateful, and dependent on external systems you do not control.
First, bots operate across multiple platforms like Zoom, Google Meet, and Microsoft Teams. Each has its own APIs, authentication quirks, and failure modes. A change in the Zoom SDK can cause join failures that look identical to a user error on Google Meet. Your analytics need to be segmented by platform to be useful.
Second, the bot's lifecycle is short and event-driven. A bot might exist for only 30 minutes. Traditional polling for status is inefficient and slow. You need an event-driven approach, like webhooks, to capture state changes as they happen. A missed event can leave a bot's status as permanently "joining" in your system, even after the meeting has ended.
Finally, the most common points of failure are outside your direct control. A host might not admit your bot from the waiting room, or a corporate firewall could block the connection. Your monitoring must distinguish between internal errors and external factors to avoid chasing ghosts.
The Core Data Source: Lifecycle Webhooks
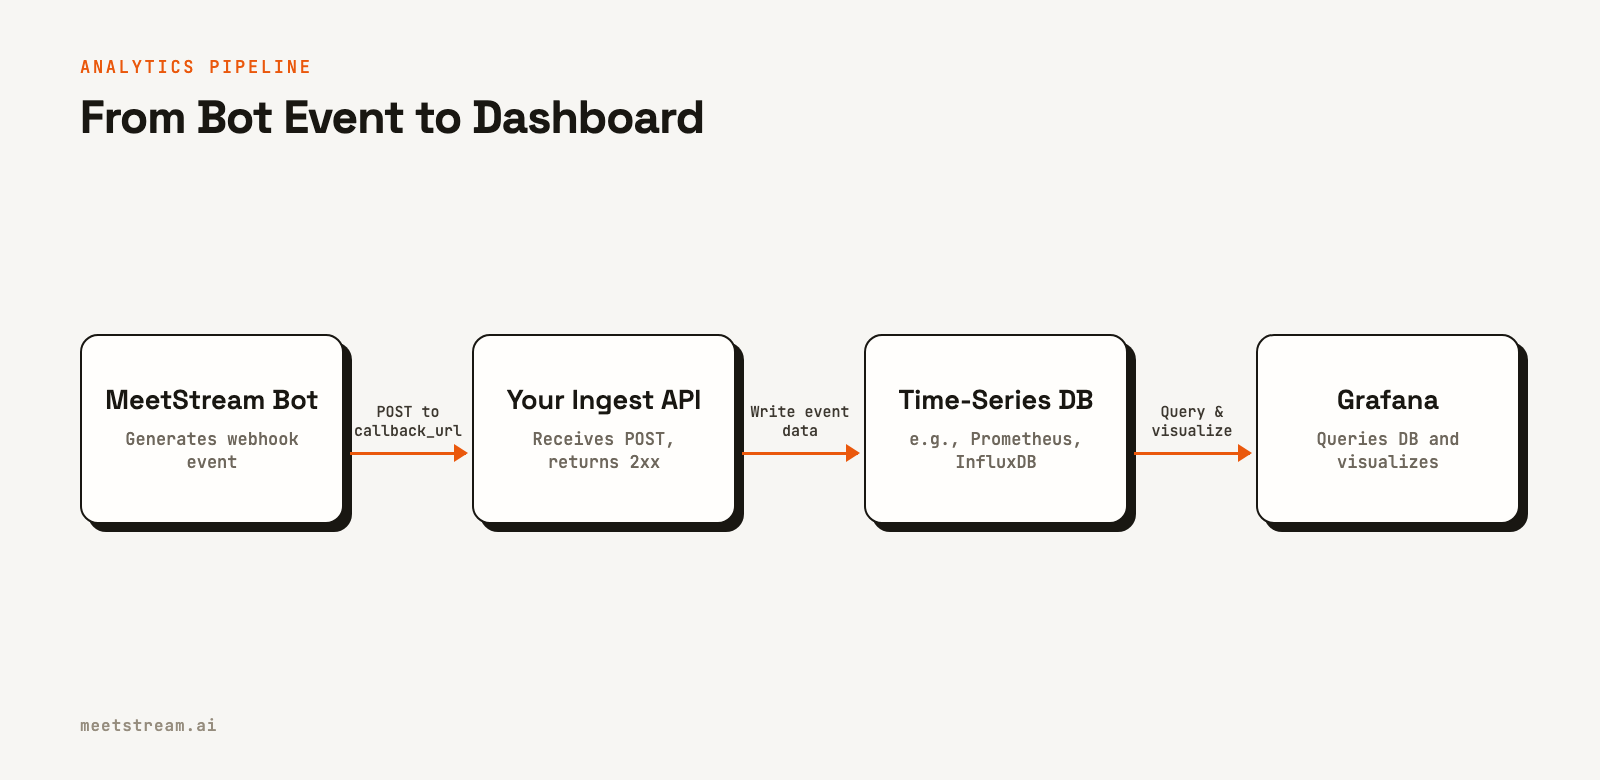
The foundation of any good meeting bot analytics system is a stream of lifecycle events. Instead of polling an API to ask "what is the bot's status?", the system should push an event to your server every time the status changes. In practice, this is done with a callback URL, a webhook endpoint you provide.
When you create a bot with the MeetStream API, you can include a `callback_url`. Our systems will then send a POST request to that URL for every significant event in the bot's life.
The payload of each webhook contains a `bot_event` field that tells you what happened. Key events for monitoring include:
bot.joining: The bot has started the process of connecting to the meeting.bot.inmeeting: The bot has successfully joined the meeting and can see and hear participants.bot.stopped: The bot has left the meeting. This is a terminal state.bot.failed: An unrecoverable error occurred, and the bot could not join or was forced to exit. The payload includes an error message.transcription.processed: The post-call transcript is ready for retrieval.
By logging these events with a timestamp, you can reconstruct the entire journey of any bot session and calculate the critical performance metrics.
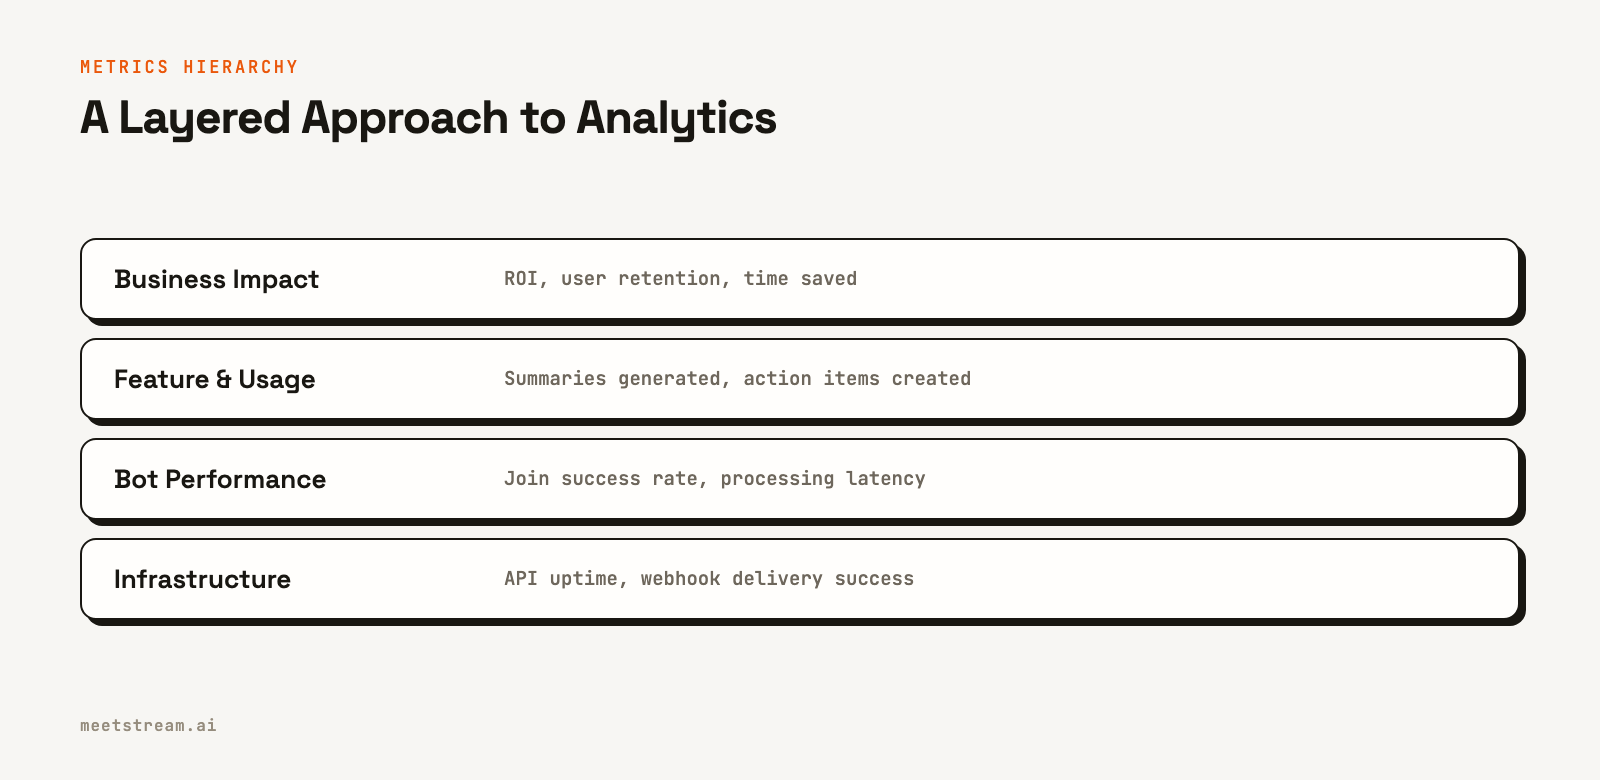
Key Performance Metrics to Monitor
With a stream of timestamped lifecycle events, you can calculate the metrics that measure the health and reliability of your bot infrastructure. These are the numbers your engineering team should watch.
Join Success Rate: This is the most critical metric. It is the percentage of bots that successfully reached the bot.inmeeting state out of all bots created. A dip in this rate is your earliest indicator of a systemic problem. You should track this overall and also segmented by meeting platform (Zoom, Teams, Meet).
Time to Join (TTJ): The duration between the bot.joining event and the bot.inmeeting event. This measures how quickly your bot can get into a call. A high TTJ can lead to a poor user experience, as the bot misses the first few moments of conversation. Monitor the average and p95 of this metric.
Failure Rate by Reason: When a bot.failed event occurs, log the associated error message. Categorize these errors (e.g., "InvalidLink", "HostNotAdmitted", "PlatformError") and track the frequency of each. This helps you prioritize fixes and distinguish your bugs from platform issues.
Processing Latency: For a post-call transcription bot, a key metric is the time from the bot.stopped event to the transcription.processed event. This tells you how long your users are waiting for their results. Tracking this helps you identify bottlenecks in your audio processing and transcription pipeline.
Key Usage Metrics to Track
While performance metrics tell you if the system is working, usage metrics tell you if it is providing value. These are the numbers your product and business teams should watch.
Meetings Joined: A simple count of successful joins (all sessions that reached bot.inmeeting) over time. This is your primary measure of user activity. Segment it by customer, team, or any other cohort that makes sense for your business.
Total Minutes Processed: The sum of the duration for all successful meetings. This is often a better measure of load and value than a raw count of meetings, as it accounts for both short check-ins and long workshops.
Feature Engagement: If your bot has specific features, like generating summaries or creating action items, you need to track their usage. You can do this by having your application logic emit a custom event to your analytics system whenever a user triggers that feature for a given meeting.
Building a Simple Monitoring Pipeline
You can build a powerful analytics system with a few standard components. A common pattern is to use a webhook receiver, a message queue, and a time-series database.
- Webhook Receiver: This is a simple API endpoint (your `callback_url`) that accepts the POST requests from MeetStream. Its only job is to validate the request, add a timestamp, and immediately push the raw event into a message queue like RabbitMQ or AWS SQS. It should return a 2xx status code as quickly as possible, as non-2xx responses are not retried.
- Event Processor: A worker process that reads events from the queue. It parses the event, extracts key fields (`bot_id`, `bot_event`, `timestamp`), and writes the data into a time-series database like Prometheus or InfluxDB.
- Dashboard: A visualization tool like Grafana that connects to your time-series database. You can then build dashboards with queries that calculate and display your key metrics, like "count of
bot.inmeetingevents in the last hour" or "95th percentile of `inmeeting_timestamp - joining_timestamp`".
This architecture decouples your data ingestion from your processing, making the system more resilient. If your database is slow or down, events pile up in the queue instead of being lost.
How MeetStream Exposes Analytics Data
The MeetStream API is designed to make this kind of monitoring straightforward. The two key features are the `callback_url` and `custom_attributes` fields in the bot creation request.
As discussed, the `callback_url` enables the event stream. The `custom_attributes` field allows you to attach your own metadata to a bot session. This is a simple JSON object where you can include identifiers from your own system, like a `user_id`, `organization_id`, or `plan_type`.
curl -X POST "https://api.meetstream.ai/api/v1/bots/create_bot" \
  -H "Authorization: Token <YOUR_API_KEY>" \
  -H "Content-Type: application/json" \
  -d '{
    "meeting_link": "<YOUR_MEETING_LINK>",
    "bot_name": "Analytics Bot",
    "callback_url": "https://yourapp.com/webhooks/meetstream",
    "custom_attributes": {
      "user_id": "usr_12345",
      "plan_type": "enterprise",
      "platform": "zoom"
    }
  }'
This `custom_attributes` object is then included in every single webhook payload sent for that bot. This makes it easy to segment your analytics. Your event processor can read these attributes and add them as tags or labels in your time-series database, letting you filter your Grafana dashboards by user, plan, or any other dimension you need.
Conclusion
For any application built on meeting bots, analytics are not a "nice to have". They are a core component for ensuring reliability, understanding user behavior, and proving value. By use lifecycle webhooks and a simple event processing pipeline, you can get the visibility you need to operate a stable service.
A data-driven approach to meeting bot analytics allows you to move from reactive firefighting to proactive improvement. Start by tracking join success rate, time-to-join, and failure reasons. This foundation will give you the insight needed to build more complex and intelligent meeting analytics and agent-based products.
See the full API reference at docs.meetstream.ai.
Frequently Asked Questions
What are the most important KPIs for a meeting bot platform?
Focus on bot join success rate, the time between key lifecycle events (like `bot.joining` to `bot.inmeeting`), webhook delivery latency, and post-call processing time. These metrics cover the critical path from a user's request to the final data delivery and surface the most common production issues.
How do I track bot performance across different meeting platforms?
Use the `custom_attributes` field in the bot creation API call to pass a platform identifier. This tag will be present in all subsequent webhook events for that bot, allowing you to easily segment metrics in your database and build per-platform dashboards in a tool like Grafana.
What is a good data model for meeting bot usage analytics?
An event sourcing model is effective. Store each webhook payload as an immutable event with a session ID (the `bot_id`) and a timestamp. This allows you to reliably reconstruct the full timeline of any bot session and run aggregations to calculate performance metrics without losing the raw data.
How do I measure the business impact of meeting automation?
Connect bot data to business outcomes. For example, track the number of action items generated by the bot and their completion rate in a project management tool. You can also survey users on perceived time saved or correlate the bot's presence in sales calls with deal progression in your CRM.


